Antibiotic exposure is associated with minimal gut microbiome perturbations in healthy term infants | Microbiome

In the longitudinal prospective cohort, we collected stool samples from n = 323 healthy African American term infants at 4, 12, and 24 months after birth (Supplement Table 1). Of these, 153 (47%) were in the unexposed group. Of the infants prescribed antibiotics, 32 (10%) were in the early exposure group, 70 (22%) in the mid-exposure group, and 68 (21%) in the late exposure group (Fig. 1A). Infants exposed to antibiotics received 2.1 ± 1.4 courses, with 55% having more than one exposure. The most common antibiotics were amoxicillin or amoxicillin and clavulanate (68% of prescribed antibiotics, Fig. 1B).

Longitudinal prospective cohort of healthy term infants and nested short-term substudy. A Overview of the main study and the short-term substudy. B The age at which various antibiotics were initiated in the main study. Amoxicillin and amoxicillin-clavulanate are shown in red. C Sample collection overview for the short-term substudy. Each row represents an infant enrolled in the study, with points indicating the day of sample collection. The bands indicate the duration of antibiotic exposure. Amoxicillin or amoxicillin-clavulanate are marked with red; other antibiotics are marked with blue
The short-term substudy enrolled 39 infants and collected four samples within 20–45 days after antibiotics initiation (Fig. 1C). The median infant age was 11 months, and 12 infants (32%) were breastfeeding. Antibiotic exposure was predominantly amoxicillin (31 infants, 79%), mirroring the longitudinal prospective cohort.
Antibiotic exposure was associated with minimal long-term differences in microbiome composition
To examine the effect of antibiotic exposure on gut microbial composition, we compared the unexposed group to each antibiotic exposure group (early, mid, late) at each timepoint (Fig. 2A). Given known breastfeeding effects on microbial composition, we included breastfeeding in our comparisons. The percentage of breastfed infants declined with age (32% at 4 months; 19% at 12 months, and 5% at 24 months). There were no differences in breastfeeding status between antibiotic exposure groups at any timepoint (P = 0.4–1.0, Fisher’s exact). We found no effect of antibiotic exposure on the overall taxonomic composition of the microbiome between antibiotic-exposed and unexposed groups (Fig. 2B). As expected from prior studies, breastfeeding was associated with overall taxonomic composition at 4 and 12 months for all exposure groups (Supplement Fig. 1A, R2 = 0.030–0.042, P = 0.0015 for all comparisons). The interaction term between breastfeeding and antibiotic exposure was not statistically significant for any comparison, suggesting that there was no microbiome response to antibiotics regardless of breastfeeding status. We also analyzed the overall gene ortholog composition between groups (Fig. 2C) and found no associations between gene ortholog composition and antibiotic exposure groups at any timepoint. However, we observed an association with breastfeeding at 4 and 12 months in comparisons for all exposure groups (Supplement Fig. 1B, R2 = 0.025–0.035, P = 0.0015 for all comparisons).
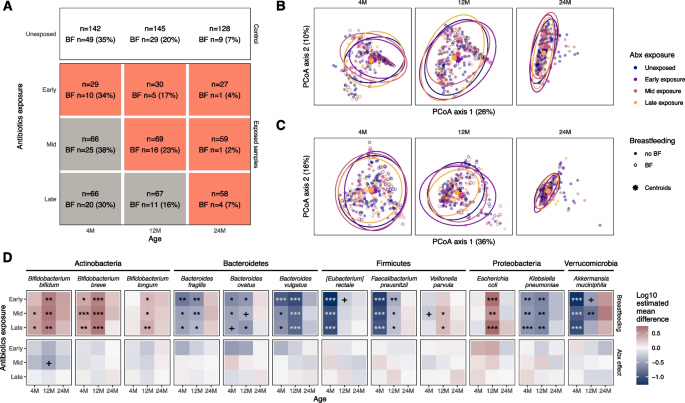
Microbiome comparison in the main cohort. A The number of samples in the unexposed group and the antibiotics-exposed groups at each timepoint. The second line in each box denotes the number and percentage of subjects who were breastfed at the time of sample collection. At each timepoint, each exposure group was compared to the unexposed group. Gray boxes represent comparisons where the group is not yet exposed to antibiotics, and thus no difference is expected. B Principal coordinates (PCoA) of bacterial taxon abundances and C gene ortholog abundances, based on Bray–Curtis dissimilarity. The PCoA was carried out for all samples together, although samples from each timepoint are displayed separately. Ellipses represent 95% confidence interval of antibiotic exposure groups. D Comparison of relative abundance for selected taxa between exposed and unexposed infant groups. Out of the 26 taxa that were tested, the ones with the highest mean relative abundance in each phylum are shown. Breastfeeding and antibiotic exposure were added as fixed effects to the linear model with log-transformed relative abundances as the outcome. The first row of comparisons indicates the coefficients with respect to breastfeeding; the second row indicates the coefficients with respect to the exposure group compared to the unexposed group. Stars represent FDR-adjusted p-values. + P < 0.1, *P < 0.05, **P < 0.01, ***P < 0.001
To examine bacterial species abundance across the antibiotic exposure groups (Fig. 2D), we first considered breastfeeding effects. As expected [32], at 4 and 12 months, breastfeeding is associated with a higher relative abundance of Bifidobacterium species. In addition, breastfeeding is associated with a higher abundance of Escherichia coli and lower abundance of Klebsiella pneumoniae, Akkermansia muciniphilia, and several Bacteroides and Clostridia species. With respect to antibiotic exposure, we observed no statistically significant associations with bacterial species abundance for any exposure group at any timepoint (Fig. 2D, Supplement Table 2). The only association related to antibiotics was a lower abundance of Bifidobacterium bifidum at 12 months in the mid-exposure group (P = 0.07). The overall results were consistent when the tests were repeated with alternative statistical methods (Supplement Fig. 2). Even though the exposure group is defined by the initial antibiotic prescription, subjects were exposed to multiple courses over the first 2 years of life. To quantify the effect of repeat exposure on the microbiome, we identified the bacteria that correlated with the total number of antibiotics courses the subjects received at each timepoint. After correcting for breastfeeding status, Bifidobacterium bifidum was negatively correlated with the number of antibiotics courses at 12 months of age, suggesting a dose-dependent effect (Supplement Fig. 3). The same effect was not seen at 4 or 24 months of age. To isolate amoxicillin effects, we repeated the comparisons excluding the 69 subjects exposed to non-amoxicillin antibiotics and found that amoxicillin exposure was associated with decreased B. bifidum abundance only at 12 months and only in the mid-exposure group (P = 0.015, Supplement Fig. 4). The inclusion of intrapartum antibiotics, delivery type, gestational age or the interaction between antibiotic use and breastfeeding did not alter the results of our analysis (Supplement Fig. 4).
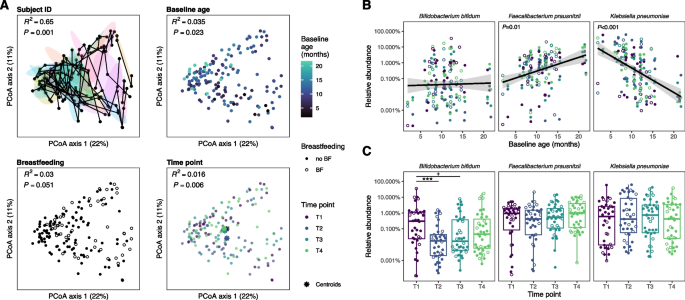
Microbiome comparison in the nested short-term substudy. A Principal coordinates analysis (PCoA) of bacterial taxon abundances, based on Bray–Curtis dissimilarity. The sub-panels are annotated by subject, age at time of first stool sample following antibiotic exposure, breastfeeding status, and timepoint. In the top-left panel, samples collected from the same subject are connected with lines; ellipses represent the 50% confidence interval for each subject where each color represents an individual. B Relative abundance of taxa as a function of baseline age. C Relative abundance of taxa as a function of timepoints in the short-term substudy. The three taxa with the greatest effect size in response to antibiotics or age are presented
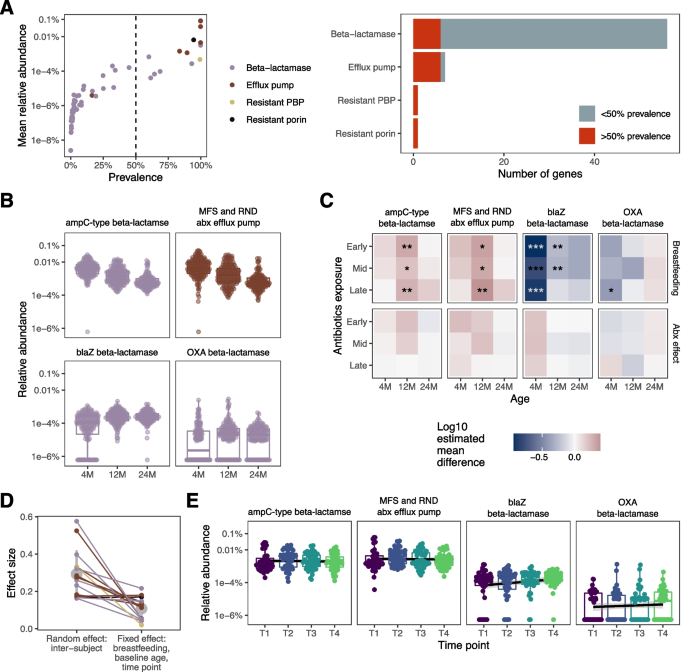
Antibiotic-resistance gene (ARG) abundance. A The mean relative abundance vs. prevalence for genes conferring resistance to panam-class antibiotics in unexposed infants from our main cohort. The dashed line represents the prevalence cutoff for further analysis. The bar chart shows the total number of genes in each category and the percentage that surpassed the cutoff. B Select ARGs that increased or decreased with age in unexposed infants from the main cohort. C Comparison of ARG abundance between exposed and unexposed infants in the main cohort. Each grid represents a set of comparisons between antibiotic-exposed infant groups and the unexposed group, as in Fig. 2D. The top row indicates coefficients for breastfeeding and the second row indicates those for antibiotic exposure group. D Relative effect size of intersubject variability vs. that of all other factors (baseline age, breastfeeding, and timepoint) in the nested short-term substudy. The mean and standard deviation of the effect sizes are marked in gray. E Relative abundance of ARGs across the four timepoints of the short-term substudy
The number of observed species (richness) in microbiome samples on average was 28% lower with breastfeeding at 4 months (P < 0.001) and 10% at 12 months (P = 0.06) and Shannon diversity was 18% lower only at 4 months (P < 0.001) in comparisons for all exposure groups (Supplement Fig. 5A), as expected from prior studies. Richness in the early exposure group was 12% lower relative to the unexposed group (P = 0.05), and Shannon diversity was 9% lower (P = 0.08) at 12 months but was not different at 4 or 24 months. We observed no difference in alpha diversity between the mid-exposure or late-exposure groups and unexposed infants at any timepoint.
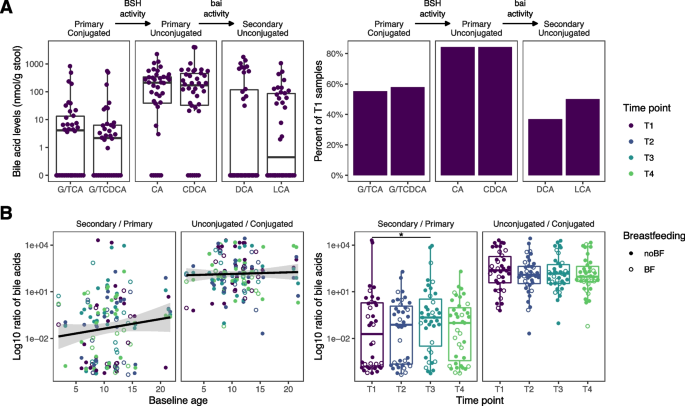
Fecal bile acid composition. A Baseline concentration and prevalence of bile acid species in the short-term substudy. B Ratio of secondary to primary bile acids and unconjugated to conjugated bile acids. Colors represent the timepoints. Open circles represent subjects currently being breastfed and closed circles represent subjects who are not breastfed
Overall, antibiotic exposure had a limited effect on the microbiome, compared to the strong and consistent associations with breastfeeding in these analyses.
Antibiotic exposure was associated with short-term microbiome perturbations that resolved over 1 month
To examine acute responses of the gut microbiome to antibiotic exposure in our short-term substudy (Fig. 1C), we analyzed microbiome community similarity based on taxonomic abundance for subject ID, baseline age, breastfeeding status, and time since antibiotic exposure (Fig. 3A). Intersubject variability had the largest effect size (R2 = 0.65, P = 0.001), followed by baseline age (R2 = 0.035, P = 0.023). Breastfeeding was not significantly associated with taxonomic composition (R2 = 0.03, P = 0.051). However, we identified a difference in taxonomic composition according to time since antibiotic exposure (R2 = 0.016, P = 0.006). In pairwise comparisons between timepoints, the second timepoint (T2) differed from all other timepoints (R2 = 0.013, 0.01, 0.015, P = 0.018, 0.027, 0.007 for T1, T3, and T4, respectively); the third (T3) and fourth (T4) timepoints were not different from baseline (R2 = 0.0097, 0.01, P = 0.097, 0.055 respectively), suggesting a temporary perturbation in microbiome community composition at the second timepoint (T2) only. Shannon diversity increased at timepoints T3 (P = 0.04) and T4 (P = 0.01) compared to baseline (Supplement Fig. 5B). Richness was not different between any timepoints (P > 0.05).
In the analysis of taxonomic abundance, among the 26 taxa tested, baseline age was associated with differences in four species, including an increase in Faecalibacterium prausnitzii (P = 0.01) and a decrease in Klebsiella pneumoniae (P < 0.001, Fig. 3B, Supplement Fig. 6A). Only Bifidobacterium bifidum was decreased at T2 and T3 relative to baseline (P < 0.001 and P = 0.06 respectively, Fig. 3C); however, the abundance did not differ between baseline and T4. On the other hand, the relative abundance of various Bacteroides species increased only at T3 compared to T1.
The first timepoint samples were collected 1.5 days after initiating antibiotics on average and do not always represent an antibiotics naïve state. Therefore, we compared the short-term substudy cohort to the unexposed group in the main cohort with samples matched for age and breastfeeding (Supplement Fig. 6B). Consistent with previous results, Bifidobacterium bifidum was lower at timepoints T2, T3, and T4 compared to the unexposed group, though the trend suggests that the levels were consistently increasing after T2. Furthermore, antibiotic exposure resulted in lower levels of Veillonella parvula at T1 and T2 which recovered at later timepoints.
Finally, we modeled the abundance of bacteria that correlate with time since initiating antibiotics to get a more sensitive estimate of time-dependent linear changes in the microbiome (Supplement Fig. 6C). Multiple bacteria such as Veillonella parvula, Akkermansia muciniphila, Faecalibacterium prausnitzii, and multiple Bacteroides species increased over the course of 1 month. These bacteria may be implicated in a pattern of short-term microbiome recovery after antibiotic exposure. No bacteria were consistently decreasing over the same time frame.
Antibiotic resistance gene abundance did not increase following antibiotic exposure
Considering the high prevalence of amoxicillin exposure in our cohorts, we focused on antibiotic resistance genes that confer resistance to the penam drug class, which includes amoxicillin. First, we evaluated the distribution of penam-class ARG prevalence and relative abundance in the unexposed group of our main cohort (Fig. 4A). For the genes that were present in at least 50% of unexposed infants, we performed an analysis of relative abundance. This group of prevalent genes included the resistant penicillin-binding protein and resistant porin orthologs, all but one of the efflux pump gene orthologs, and six beta-lactamase gene orthologs. To establish a baseline for penam-class ARGs, we evaluated the relative abundance of each gene ortholog over time in the unexposed group. Most orthologs decreased in abundance at 12 and 24 months, relative to 4 months (Fig. 4B and Supplement Fig. 7). Two orthologs increased with age: the blaZ and OXA beta-lactamases (Fig. 4B).
Next, we compared antibiotic-exposed to unexposed groups in our main cohort using the same approach described above (Fig. 4C, Supplement Fig. 8). No significant differences in ARG ortholog abundance were seen for any antibiotic exposure group; however, we observed associations between ARG abundance and breastfeeding status at 4 and 12 months. Furthermore, the ARGs with less than 50% prevalence showed no association with exposure groups with Fisher’s exact test.
In our short-term substudy, we assessed the degree of intersubject variability in ARG abundance compared to baseline age, breastfeeding, and time since antibiotic exposure (Fig. 4D). In all but two of the genes tested, the between-subject variability was greater than the combined effects of all other variables tested. Thus, intersubject variability was the leading factor associated with ARG abundance in the weeks after antibiotic exposure. Moreover, ARG ortholog abundance was not different from baseline at any follow-up timepoints (Fig. 4E, Supplement Fig. 9). Furthermore, despite the association between B. bifidum abundance and antibiotic exposure at T2, the difference was not reflected in ARG ortholog abundance.
Antibiotic exposure did not inhibit microbiome modification of bile acids in the short-term substudy
In infancy, the gut microbiome gradually acquires the ability to deconjugate primary bile acids and transform them into secondary bile acids [33]. To determine if antibiotic exposure altered the succession of important metabolic functions, we first examined baseline bile acid concentrations. At baseline, microbial communities efficiently deconjugated primary bile acids in 92% of the samples (Fig. 5A). However, only 55% of the subjects had the functional capability to convert primary into secondary bile acids.
To assess the two sequential bile acid-modifying processes quantitatively, we analyzed the ratio of unconjugated to conjugated primary bile acids (quantifying deconjugation), and the ratio of secondary to primary bile acid concentrations (quantifying conversion to secondary bile acids). Following the same modeling approach used previously (Fig. 5B), we did not observe a significant effect of baseline age or breastfeeding on either of the bile acid ratios. Intersubject variability was the overriding factor in terms of effect size. The secondary to primary bile acid ratio at T3 was higher relative to baseline (P = 0.01), indicating an increased capability of the gut microbiome to convert primary to secondary bile acids. At T2 and T4, bile acid ratios were not different from baseline in our short-term substudy.
link




:max_bytes(150000):strip_icc()/asian-sick-little-girl-lying-in-bed-with-a-high-fever-952683074-5b5b784046e0fb005027ca13.jpg)

