The impact of breastfeeding on the preterm infant’s microbiome and metabolome: a pilot study

Characteristics of infants and mothers in the cohort
This study analyzed samples collected from a cohort of preterm infants from the MAP study.17 The clinical data from the cohort of 11 infant-maternal dyads showed an average maternal age of 29 years; 100% of mothers received prenatal betamethasone, 73% of mothers underwent a cesarean section, and 45% of mothers experienced premature prolonged rupture of membranes and received latency antibiotics (Table 1). The average GA at birth was 27.9 weeks; 64% of infants were intubated and received surfactant, 73% of infants received antibiotics for ≥2 days, and 18% received an antifungal (Table 2). Further characteristics including preterm morbidities are found in Supplementary Table 1.
All infants received HM or donor HM, bovine-based HM fortifier, and/or preterm formula (Supplementary Table 2) based on the unit’s feeding policy, infant’s clinical status, and infant’s corrected GA (CGA) at the time of sample collection. All infants followed the NICU’s standard feeding policy which bases enteral feeding progression on the infant’s weight at birth. Infants initially received unfortified HM (with donor HM as supplementation if HM not available or insufficient) and were fortified to 22 kcal/oz at 80 ml/kg/day and 24 kcal/oz at 120 ml/kg/day, with further fortification added per individual need. They were allowed to participate in non-nutritive breastfeeding when >30 weeks CGA as long as they were considered medically stable independent of the type of non-invasive respiratory support they were receiving. Oral feeding (via breastfeeding and/or bottle) was initiated when the infant was on minimal respiratory support (low flow nasal cannula) and showing oral feeding cues, which was typically around 34 weeks CGA. When starting oral/breastfeeding, each infant followed a standardized protocol with a combination of oral and tube feeds, until they reached full oral feeds. For each subject, 4 longitudinal samples were collected, two prior to the start of oral feeds and two after starting oral feeds. On average, timepoint 1 was collected at 2 weeks of life, timepoint 2 at 5 weeks of life, timepoint 3 at 9 weeks of life, and timepoint 4 at 12 weeks of life (Table 3). A total of 39 stool, 44 saliva, and 43 milk samples were analyzed. Additional information on infant’s weight gain on tube versus oral feeds is available in Supplementary Table 3.
Transition to oral feeds had the greatest impact on the saliva microbiome diversity
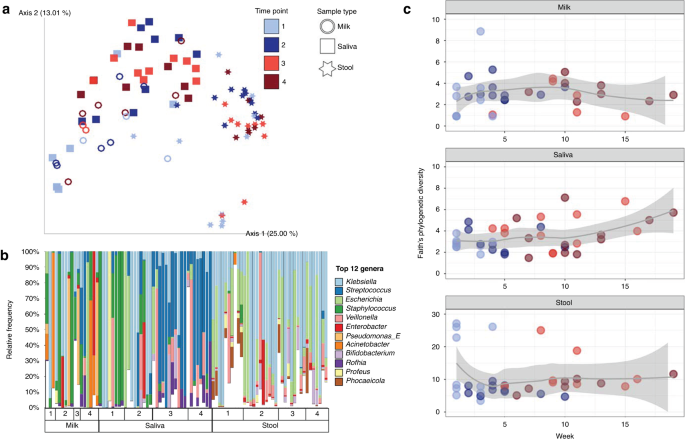
Microbial communities were significantly influenced by sample type (R2 = 0.24, p = 0.001; all groups distinct, p = 0.001), subject (R2 = 0.14, p = 0.001), and time point (R2 = 0.04, p = 0.001), with significant interactions between all these factors (Fig. 1a, PERMANOVA on Unweighted UniFrac distances). Statistical findings were comparable when using weighted UniFrac, which incorporates relative abundance information.

a PCoA plot based on Unweighted UniFrac distance matrix, with rarefaction level of 260,960 sequences per sample (milk, n = 17; saliva, n = 36; stool, n = 37). b Top 12 most relatively abundant bacterial genera identified across the dataset are shown for all sample types across time points, rarefied at 121,270 sequences per sample. The remaining other taxa are grouped in white. c Alpha diversity by the Faith’s Phylogenetic Diversity metric over time (weeks of life) within each sample type (milk, n = 33, rarefied at 2990; saliva, n = 39, rarefied at 47,195; stool, n = 37, rarefied at 1,288,710).
The highest microbial diversity, as measured by Faith’s Phylogenetic Diversity, observed features, and Shannon diversity, was detected in stool (p < 0.05 compared to milk and saliva). Milk and saliva were not significantly different. An increase in microbial diversity was observed in saliva samples over time but not the other sample types (Fig. 1c). To examine the relative effects of oral feeding status, week of life, milk type, delivery method (cesarian vs. vaginal), and twin status, we tested mixed effects models within sample types, using null models that included only subject. For saliva samples, there was a significant impact of the transition to oral feeds on saliva alpha diversity (p = 0.007), and each subject’s temporal trajectory was personalized (p = 0.005, week added in random effect term with subject). For stool, delivery method and week of life had significant effects (p = 0.035 and p = 0.015, respectively), and milk type, before vs. after oral feeding transition, and the personalized effect of week of life contributed to the best the model (p = 0.032). For milk samples (excluding formula), there was no significant trend over time in terms of week of life or oral feeding status, however the model was improved by including milk type (fortified vs. unfortified) as a fixed effect (p = 0.035).
Milk type and transition to oral feeds impacts microbial communities
To tease apart microbial community dynamics, we analyzed the effect of subject and time point on beta diversity within each of the three sample types. In milk samples there were significant effects of both subject (R2 = 0.32, p = 0.006) and time point (R2 = 0.06, p = 0.017, PERMANOVA on Unweighted UniFrac distances), with no significant pairwise differences. Milk types also had significantly different microbial communities, with unfortified and fortified maternal milk hosting unique communities (R2 = 0.1, p = 0.001, PERMANOVA on Unweighted UniFrac distances) (Supplementary Fig. 1). Formula samples had low sequencing depth (1770–2491 sequences per sample, n = 4) so were excluded from the overall analysis. The four formula samples contained only 1 species that was confidently assigned after quality filtering, Streptococcus thermophilus.
For milk samples (formula excluded), examination of the most differential bacteria between the beginning and ending time points of the study revealed changes in the ratios of certain bacterial groups over time. The most differentially represented top 20 taxa were assigned to Enterobacter, Streptococcus, Klebsiella, Veillonella, Rothia and Mesorhizobium (Fig. 1b); whereas the bottom 20 taxa were within the genera Stenotrophomonas, Serratia, Haemophilus, Enterococcus, Cutibacterium, Pseudomonas, Staphylococcus and Lactobacillus. The ratio of these two groups increased over time, with significant differences between timepoints 1 and 3 and 1 and 4 (p < 0.05; Supplementary Fig. 2) reflecting the transition from tube to oral feeds.
Stool microbiome did not significantly change after the transition to oral feeds
Stool samples were not significantly influenced by subject or time point for the Weighted or Unweighted UniFrac metrics (p > 0.05, PERMANOVA). The type of milk consumed by the participant at the time of sampling did have a significant effect on the microbial communities when relatedness was included but relative abundance was not accounted for (R2 = 0.12, p = 0.036, PERMANOVA on Unweighted UniFrac distances). At the genus level, Klebsiella and Escherichia were overall the most relatively abundant and prevalent Enterobacteria found in the stool (Fig. 1b). Differential rankings showed that changes in ratio of the relative abundances of Escherichia and Klebsiella to Bacteroides were different only between timepoints 1 and 2 (p < 0.05). We further observed significant differences in the ratio of Bifidobacterium to Bacteroides in stool microbiota between time points 1 and 2 and time points 1 and 4 (p < 0.05; Supplementary Fig. 3). No specific taxa were found to vary in prevalence or relative abundance in stool following the initiation of oral feeds (after time point 2).
Streptococcus and Klebsiella increase in the salivary microbiome after the transition to oral feeds
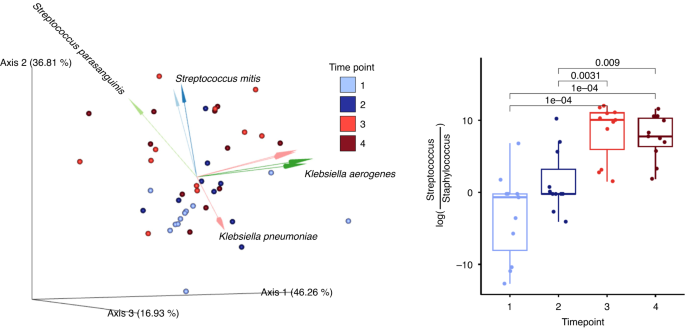
Microbial communities in saliva samples were influenced most strongly by subject (R2 = 0.42, p = 0.001, PERMANOVA on Unweighted UniFrac distances), time point (R2 = 0.11, p = 0.001, PERMANOVA on Unweighted UniFrac distances), and milk type (R2 = 0.05, p = 0.006, PERMANOVA on Unweighted UniFrac distances), with significant interactions between these three factors (Fig. 2). For time point, there were significant differences when comparing time points 1 and 2 to 3 and 4 (pairwise PERMANOVA, p < 0.02). Similar results were observed with Weighted UniFrac distances. Due to a significant interaction between subject and time point in saliva microbiota, we subset the analysis to participants with the complete time series. For this subset, despite the much-reduced sample size (6/11 participants), significant effects remained for both time point (R2 = 0.144, p = 0.022, PERMANOVA on Unweighted UniFrac distances) and subject (R2 = 0.377, p = 0.003, PERMANOVA on Unweighted UniFrac distances). Across all participants, the difference between saliva microbiota collected during tube feeding or during oral feeding time points was in part driven by changes in ratio of the relative abundances of Staphylococcus to Streptococcus, as well as Klebsiella and Veillonella sp. F0422 (Fig. 2).

(Left). Principal component analysis of robust Aitchison distance (RPCA) plot with only saliva samples. The dots are color coded by time points and the biplot arrows are colored by groups of bacterial operational genomic units (OGUs) influencing saliva microbiota community dissimilarity. (Right). Box plots of log ratio of all of the OGUs identified within the genera Streptococcus and Staphylococcus. Log ratios were calculated and processed using Songbird multinomial regression and visualized in Qurro. Statistical significance was determined by linear mixed effect models, LME, p < 0.05.
Delivery method in preterm infants does not significantly influence the microbiome
In contrast to studies of full-term infant microbiomes, delivery method (vaginal versus cesarean section) did not exert a significant influence on the stool microbiome (p = 0.283, PERMANOVA on Unweighted UniFrac distances), saliva microbiome (p = 0.08, PERMANOVA on Unweighted UniFrac distances), or milk microbiome (p = 0.335, PERMANOVA).3,4,6 Delivery mode did not have a significant effect using Weighted UniFrac for the entire dataset or any individual sample type. A potential effect of delivery mode was identified in the alpha diversity of stool; however sample size was limited. Clinical factors such as age at time of sample, sex, twin status, birth weight, antibiotic use, maternal chorioamnionitis, and number of days intubated were examined, however the low sample size and unique clinical history of each participant did not result in any statistical significance of these factors.
Transition to oral feeds impacts the milk metabolome
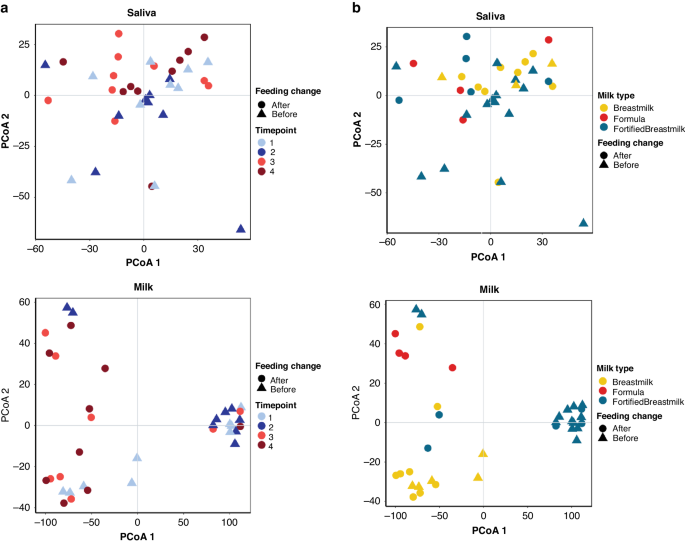
To continue our understanding of the impact of tube feeding in the developing infant microbiome we conducted a metabolomics analysis of stool, saliva, and milk samples individually. Milk samples were significantly influenced by time point, feed change, and milk category (PERMANOVA on Bray-Curtis Dissimilarity p < 0.05) (Fig. 3). Stool samples were significantly influenced by mass spectrometry acquisition, or batch effect, (PERMANOVA on Bray-Curtis Dissimilarity p < 0.001) and were thus excluded from further analysis. Saliva samples displayed no significant influences (PERMANOVA on Bray-Curtis Dissimilarity p > 0.05). Time point (Fig. 3a) and milk type (Fig. 3b) influences on saliva and milk samples were visualized using PCoA, where milk samples displayed strong influences based on milk type (HM, fortified milk, or formula).

a PcoA using Bray-Curtis Distance of saliva (top) and milk (bottom) samples. Points colored by time point and shape by feeding change group (Before: NG/Tube-feeding; After: Post- NG/Tube-Feeding). b PcoA using Bray-Curtis Distance of saliva (top) and milk (bottom) samples. Points colored by milk type and shape by feeding change group (Before: Tube feeding; After: Oral feeding).
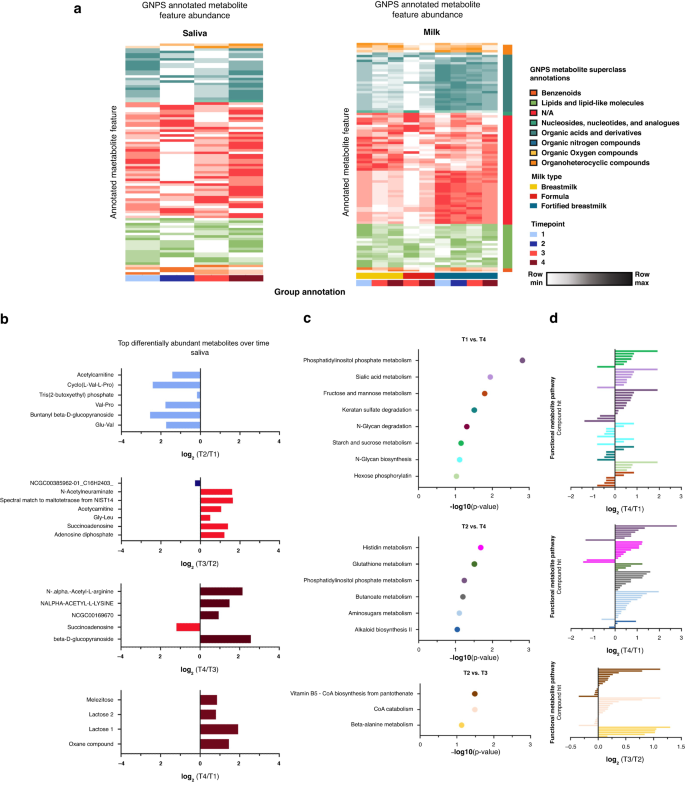
As sample time point significantly influenced metagenomic data, we chose to conduct binary comparisons of saliva and milk metabolomics samples by time point, with several significantly altered metabolites found in each binary comparison. We annotated our identified metabolite features through MS/MS annotation using GNPS. Here we found 116 (4.0% annotation rate) annotated saliva and 128 (6.6% annotation rate) annotated milk metabolites. Several GNPS annotated features were significantly altered when comparing by time point (Supplementary Fig. 4). Time point was not independent from milk type, as many participants began on fortified milk and changed to formula or unfortified HM during the course of the study. To further understand changes in GNPS annotated features we plotted average abundance by stratifying milk and saliva samples by milk type and time point, respectively. While saliva samples showed no visible pattern, milk samples showed changes in abundance of metabolites by milk type (Fig. 4a). Specifically, fortified HM had higher abundance of organic acids and derivatives, while unfortified HM had higher abundance of lipids and lipid-like structures. Interestingly, among the altered metabolites in the saliva metabolome were “Lactose products” which were significantly enriched in in timepoint 4 when comparing to timepoint 1 (Fig. 4b).

a Heatmap of GNPS annotated metabolite features in saliva and milk samples colored by metabolite (row) min to max milk-type across time points. Metabolite average intensity by time point was used for visualization. Column grouping was done by time point and milk type in saliva and milk samples respectively. b Bar plots showing differently abundant GNPS annotated metabolites in saliva samples based on timepoint binary comparisons. Significantly altered metabolites are colored by time point in which they are found to be higher in each respective binary comparison. c MetaboAnalyst functional pathway analysis across time points for saliva samples. Samples were sorted by p value of the respective binary comparisons for pathway analysis. d MetaboAnalyst functional pathway compound hits with their respective log2-fold change per comparison. Bars are colored by pathway hit.
Because several of the GNPS annotated metabolites lacked functional superclass information, we sought to explore functional metabolic changes using MetaboAnalyst. We conducted a functional pathway analysis using MS1 Peak information for saliva samples for putative metabolite annotation. Functional analysis revealed several significantly altered functional pathways across time points in saliva samples (Fig. 4c). Among the altered pathways were phosphatidylinositol phosphate metabolism, sugar metabolism, amino acid metabolism, and vitamin B5 biosynthesis, where a majority of compound hits were observed to have increased abundance after oral feeding implementation (timepoints 3 and 4) compared to tube feeding time points (timepoints 1 and 2) (Fig. 4d).
link


:max_bytes(150000):strip_icc()/asian-sick-little-girl-lying-in-bed-with-a-high-fever-952683074-5b5b784046e0fb005027ca13.jpg)

